Fairlead Tactics – Weekly Technical Strategy
March 3, 2021
Listen to Katie Stockton’s daily audio recording from Wednesday, March 3, 2021, recapping the below.
U.S. Equities
- SHORT-TERM BIAS – BEARISH: Short-term momentum has weakened since mid-February when the SPX discovered resistance near 3950. A pullback of more than 4% failed to yield an oversold reading in the daily stochastics, suggesting stabilization near the 50-day MA will be only temporary. Many high-beta stocks have already broken their 50-day MAs in a bearish example for the 65% of the S&P 500 constituents that are still above theirs (i.e., breadth has room to contract further). Below the 50-day MA, the first major support for the SPX is defined by former resistance near 3588.
- LONG-TERM BIAS – BULLISH: The bull market is very much intact according to long-term trendlines and measures like the monthly MACD indicator. Breakouts in Q4 2020 fostered long-term momentum, allowing for a measured move projection of about 4600 for the SPX, a level that we think is achievable in 2022. The path to this level is likely to be interrupted by corrective periods, which are difficult to navigate but create demand for equities as valuations appear more compelling. Our intermediate-term indicators suggest a corrective phase has begun, and we expect it to ultimately refresh the long-term uptrend.
- TACTICS: Stay with top-down hedges to manage risk of a deeper pullback as long as the CBOE Volatility Index (VIX) holds up above support near 20. Hold core long positions that are supported by positive intermediate- and long-term momentum, based on the weekly and monthly MACDs. Temporarily reduce exposure to stocks that are falling from overbought territory in absolute and relative terms (vs. SPX), particularly those with confirmed counter-trend signals from the DeMARK Indicators®. Consider short positions where negative technical catalysts arise, such as breakdowns below short-term support levels.
Technical Long / Short Ideas
- ADDITIONS: We added APD to our long ideas given an intermediate-term oversold upturn near cloud-based support, in addition to DISH which has seen momentum improve near its 200-day MA.We added TWTR to our short ideas because it appears overextended per the DeMARK Indicators® and has a good deal of room to initial support, in addition to WAT due to its overbought downturn.
- REMOVALS: We removed Dollar General (DG) and Prologis (PLD) from our long ideas because they have broken down, but they appear poised for oversold bounces for better selling opportunities. We also removed DexCom (DXCM) because it confirmed a counter-trend signal from the DeMARK Indicators®.We removed Micron Technology (MU) from our short ideas because it has upheld positive momentum, in addition to Take-Two Interactive Software (TTWO) to make room for new ideas.
Technical Themes
- Short-term weakness has been significant enough behind the SPX to generate “sell” signals in both the weekly MACD indicator and weekly stochastics, suggesting the pullback may give way to several weeks of additional consolidation. The MACD “sell” signal reflects a loss of intermediate-term momentum, and while whipsaws can occur (e.g., October 2020), we would be respectful of this signal because it is associated with a downturn in the weekly stochastics < 80%. Past instances of these combined downturns, denoted by red arrows, have historically been found in the early stages of corrective periods.
- We do not make a practice of overlaying technical indicators on mortgage rates, but we felt it would be a good exercise given the correlation to Treasury yields and implications for our readers. The backup in the average 30-year fixed mortgage rate from a low of 2.82% to a high of 3.25% over the past month has generated the first intermediate-term “overbought” condition since late 2018. Momentum has turned to the upside within the long-term downtrend, but the spike in mortgage rates cannot be differentiated from the fleeting upmove in March 2020. The chart shows resistance for mortgage rates at past lows near 3.4%.
U.S. Sectors
WTI Crude Oil and Gold
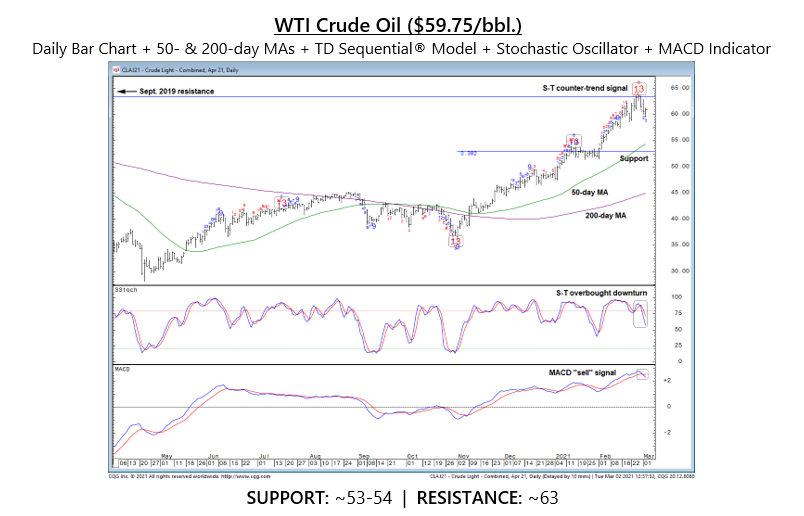
- WTI crude oil futures are retreating from their highs after having gained more than 18% in February. The uptrend is supported by positive intermediate-term momentum, but a deeper pullback appears likely per our short-term trend-following gauges. A new MACD “sell” signal is affirming a counter-trend signal from the DeMARK Indicators®, supporting consolidation as in January. Also, the daily stochastics have fallen from overbought territory following an unsuccessful test of long-term resistance. Support is defined by the 50-day MA and a Fibonacci retracement level, but we would revisit WTI crude oil once its stochastics turn up.
- Last week, gold fell decisively below November’s low and cloud-based support. The breakdown is pending confirmation this Friday on a close below $1755/oz. The downtrend channel that took hold in August remains intact, and risk of long-term downside follow-through would be heightened by a confirmed breakdown. Intermediate-term momentum is negative, but oversold conditions are being enhanced by a counter-trend signal from the DeMARK Indicators® that supports four weeks of stabilization. If the breakdown is confirmed, we would turn our focus to next support near $1675-$1685/oz.
Currencies and Treasury Yields
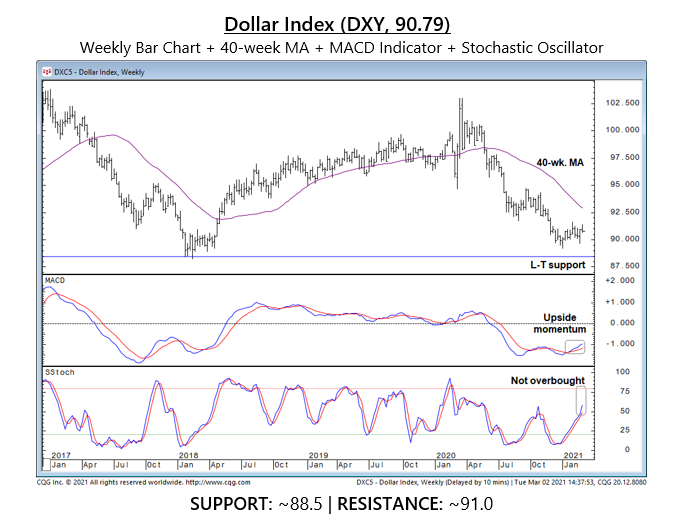
- The Dollar Index has seen intermediate-term momentum shift to the upside this year, based on the weekly MACD indicator. We attribute this to long-term oversold conditions behind the U.S. dollar, which has stabilized after having weakened for about a year. Short-term momentum improved last week, but cloud-based resistance (not shown) presents a hurdle near 91.0. A decisive breakout above this level would target secondary resistance defined by the 200-day (~40-week) MA. Otherwise, we would assume the downtrend still has a hold on the Dollar Index, which has strong long-term support near 88.5.
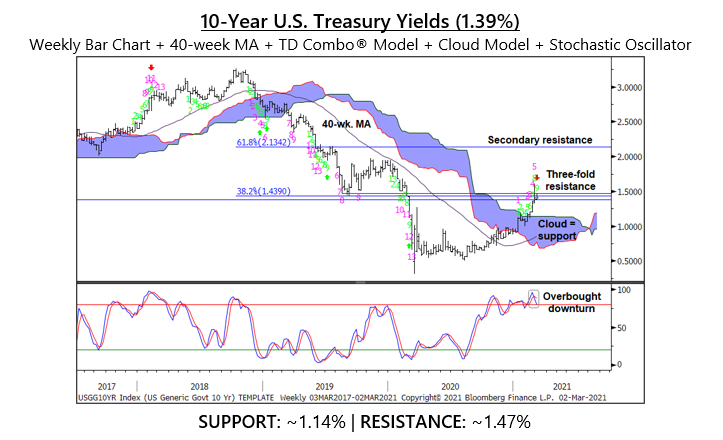
- 10-year Treasury yields added 34 bps in February, confirming a breakout above cloud-based resistance near 1.14%, now initial support on the chart. The reversal is supported by intermediate-term upside momentum, but an overbought downturn supports a pullback from three-fold resistance in the 1.4%-1.5% area before upside follow-through. There is a counter-trend signal from the DeMARK Indicators® that is supportive of four weeks of consolidation as an indication of duration. If a breakout unfolds despite indications of a pullback (or, after a pullback) secondary resistance near 2.13% would be targeted.
Fairlead Strategies is an independent research provider founded in 2018 by award-winning technical analyst, Katie Stockton, CMT. Fairlead provides comprehensive technical coverage of financial markets shaped by 25 years of experience to financial institutions, investment advisors, and individuals. Fairlead’s methodology facilitates tactical market timing and risk management in a welcome complement to fundamental and macro research.
Please visit www.fairleadstrategies.com to sign up for a free trial, and for more information about Fairlead Strategies’ subscriptions and services.
Fairlead Tactics is a weekly newsletter published by Fairlead Strategies LLC. Information presented herein has been obtained from sources believed to be reliable, but the accuracy and completeness of summaries, conclusions, and opinions based on this information are not guaranteed. It should never be assumed that recommendations will be profitable or will equal the past performance of listed or recommended securities.
For access to our full disclaimers and disclosures, including our policy regarding editor securities holdings, go to https://www.fairleadstrategies.com/disclaimers-and-disclosures or email [email protected].





Leave a Reply
You must be logged in to post a comment.