The Global Loss of the U-Shaped Curve of Happiness
June 6, 2024
Intro from Zach Rausch and Jon Haidt:
Over the last year, Zach has written a series of articles examining the international scope of the youth mental health crisis. In his five-part series, he has shown that measures of anxiety, depression, and other measures of poor mental health among youth have worsened in the five Anglo nations, the five Nordic nations, and many other nations throughout Western and Eastern Europe. Zach has also shown that suicide rates are up for Gen Z girls across the Anglosphere, with higher rates than any generation of girls that came before them.1 He also found the same trends for emergency department visits and hospitalizations for non-fatal self-harm. In addition, Zach has documented variations in suicide and self-harm across Europe, showing that social, cultural, and religious factors have a mitigating effect on such behaviors.
But even as the evidence of a multinational youth mental health crisis increases, there are a few researchers who continue to argue that the youth mental health crisis is not real or (for some skeptics) it is grossly exaggerated in the USA and is limited to the USA. Some claim, for example, that perhaps “More check-ups, more screenings, and more protections for behavioral health conditions lead to lots of kids screening positive for depression and getting diagnosed—helping to explain the rise in self-reported depression since 2011.”2 Or those who show the “graphs that Haidt doesn’t want you to see.”3 Or those who claim that “…Indeed, most of this stuff is just the U.S. I suppose there may be a few other places here and there, but there’s no international trend, sorry.”4
In early April, the Dartmouth labor economist and adviser to the UN David Blanchflower (goes by “Danny”), reached out to us (Jon, Zach, and Jean Twenge), telling us that he had independently found the same pattern of youth decline that we have been examining across numerous datasets and countries. He found that the classic “U-shaped curve of well-being” and the“hump-shaped curve of ill-being” have recently disappeared because young adults (18-25) have been doing so much worse since the mid-2010s (especially young women). Before he began studying trends in young people, he had been focusing on the mental health of middle-aged adults and the “deaths of despair” literature popularized by Case & Deaton (2020). He explained that he had not noticed the changes among young people until more recently because he was so focused on the traditional groups that were struggling most (such as middle-aged less-educated white men, and Native Americans).
But after seeing how rapid the change in young adult mental health has been, in contrast to the relative stability of adults over 40, he has shifted focus. He has now published his own series of articles on the topic and has shown something astonishing and of global importance: the general contour of happiness across the age-span has changed around the world. Young adults are now the least happy people, and this broad multinational change began sometime in the mid-2010s, right as Gen Z was entering this age-group.
Danny co-wrote this essay with his research partner, Alex Bryson, a University College, London professor. Their findings offer a strong response to those who say that “the kids are alright.”
– Zach and Jon
There is a literature of at least 600 published papers suggesting that happiness is U-shaped in age and, conversely, that unhappiness is hump-shaped in age. In other words, when a person is young, they are as happy as they are going to be until old age (on average; individual lives vary). For many, their student days were the happiest days. The evidence of a midlife low period centered around age 50 had been found across 146 countries over the period 1973-2017. Across a variety of datasets and measures, the finding of a midlife low has been consistently replicated. The U-shape has been apparent across a whole range of well-being metrics, including life satisfaction, financial satisfaction, worthwhileness, and happiness. Every U.S. state had a U-shape.
But not anymore. It seems that the well-being of young adults (ages 18-25), especially young women, went into precipitous decline beginning around 2017 (with some evidence showing around 2014, see Figure 1).
The mirror image of the U-shape in well-being is a hump-shape in ill-being by age—including worry, stress, and depression—which has a peak at around age 50. In other words, when measures of ill-being are examined, it used to be the case that young people had low levels of mental ill health, and as they got older, ill health increased, reaching a peak at around age 50 before it then started to improve. Peak ill-being in mid-life coincides with deaths of despair from suicide, drug overdoses, and alcohol poisoning, which also peak in mid-life, as do psychiatric admissions and the taking of anti-depressants. The trends in these deaths have a robust association with these ill-being markers – unhappiness, sadness, and stress.
The hump-shape pattern has been observed in panel data tracking well-being within individuals over time, suggesting well-being changes over the life course. And the relationship was apparent in multiple cohorts. This means that the same path was followed for people who were born in the 1940s, 1950s, 1960s, 1970s, and 1980s. All of these cohorts saw mid-life crises with peak unhappiness in midlife. Claims have been made that the mid-life hump was linked to changes in what people expect from life over time or set points against which individuals calibrate how their life is unfolding. The pattern was even apparent in apes, leading some to speculate that the life course of well-being is linked to psychological traits common to primates.
That was then. And now everything has changed. The hump shapes and U-shapes in age have disappeared into the ether. Now, young adults (on average) are the least happy people. Unhappiness now declines with age, and happiness now rises with age—and this change seems to have started around 2017. The prime-age are happier than the young. The evidence for this transformation first became apparent in the United States and the United Kingdom, but it is now true in 82 countries worldwide.5
In the rest of this article, we will outline the changes in the well-being of the young, and especially that of young women, that have resulted in the global disappearance of the U-shape in happiness and the hump shape in unhappiness. We present evidence for this negative relationship between age and mental health in 82 countries.
The Loss of the Hump-Shape Pattern for Ill-Being
Figure 1 plots trends in despair by age group and gender in the United States from 2009 to 2022 using the Behavioral Risk Factor Surveillance System (BRFSS) surveys. Following Blanchflower and Oswald (2020), our despair measure is based on those who gave the answer “30” to the question: Now, thinking about your mental health, which includes stress, depression, and problems with emotions, for how many days during the past 30 days was your mental health not good?”
Figure 1 plots these despair data for the U.S. going back to the early 1990s for different sub-groups in the US population (men and women, over and under 25 years-old). The figure plots the proportion of people saying that in the past 30 days, all 30 were bad mental health days.
Despair by Age and Sex, 1993-2022 (U.S. Adults)
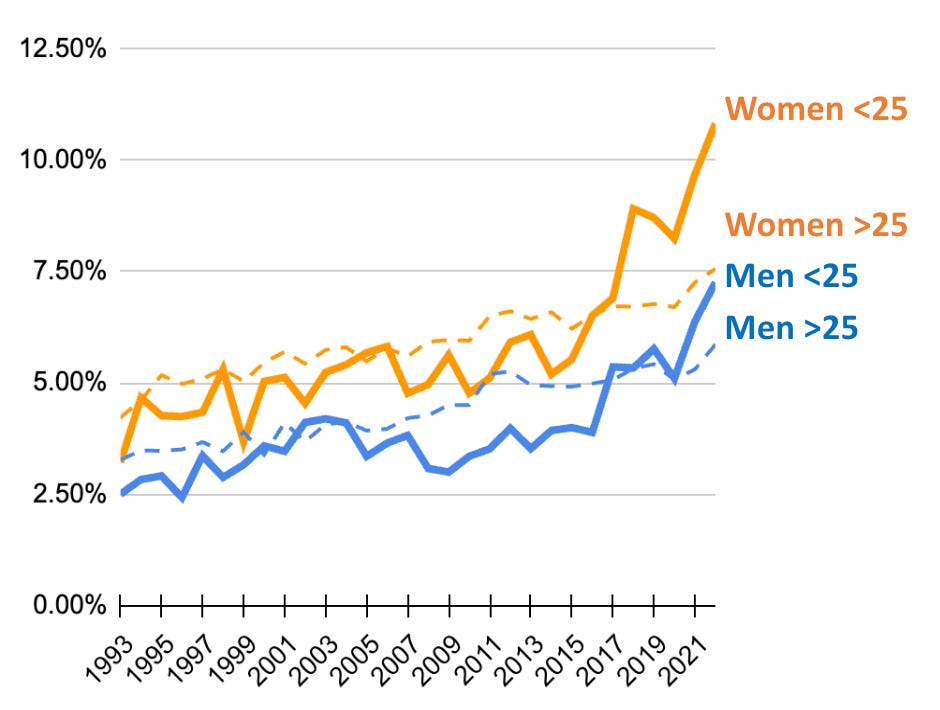
Figure 1. Despair by age (1993-2022). The proportion of people saying that in the past 30 days, all 30 were bad mental health days. Rises in despair began around 2015 for women and 2017 for men. Source: Behavioral Risk Factor Surveillance System (BRFSS) surveys.
Young Women Have Caught up to Those Who Used To Have Highest Rates of Despair
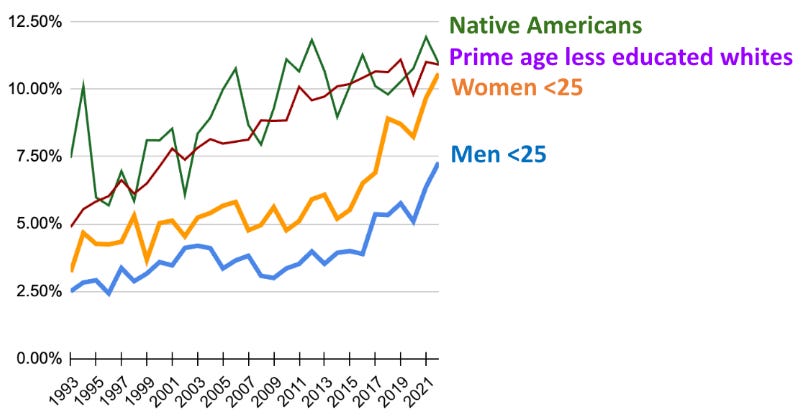
Figure 2. Despair by age and cohort (1993-2022). Source: Behavioral Risk Factor Surveillance System (BRFSS) surveys.
Our 2024 paper found similar age-specific patterns. We observed a rapid rise among college students from the Healthy Minds Surveys from 2007-2022 in the proportion saying they have been feeling down, depressed, or hopeless for more than half the days over the prior two weeks, up from 12% to 20% for males and from 14% to 28% for females, respectively. We also found a rise in high school students’ despair, sadness, and hopelessness using the Youth Behavior Surveillance System data.
These changing mental health trends have resulted in a very different relationship between age and ill-being over time, as indicated in Figure 3.
Changes in Despair by Age, USA (2012-2022)
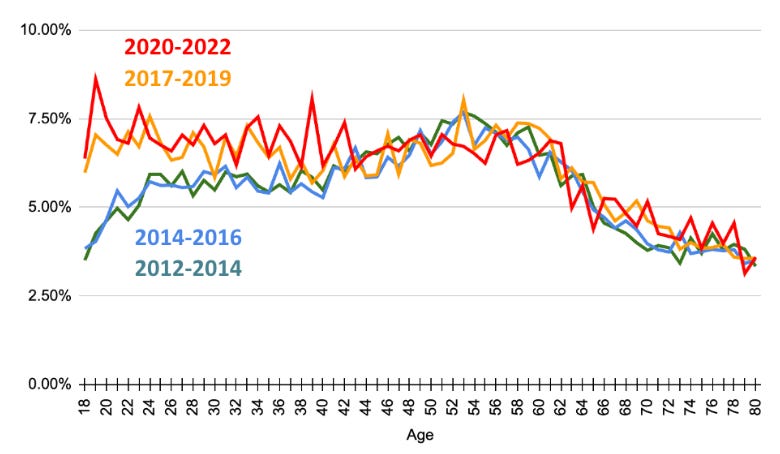
Figure 3. Changes in Despair by Age. Age is on the X-axis; percent reporting 30 days of poor mental health in the last 30 days on the Y-axis. Source: Behavioral Risk Factor Surveillance System (BRFSS) surveys.
For both males and females (see supplement for graphs split by sex), the hump shape has disappeared. Between 1993 and 2016 (for women) and 2017 (for men), despair was hump-shaped in age, very much in accordance with the literature discussed above. The rapid rise in despair before the age of 45, and especially before the mid-20s, has fundamentally changed the lifecycle profile of despair such that the hump shape is no longer apparent. Despair rose the most for the youngest group, but there was no change for those over age 45. In fact, despair now declines with age. The recent data also shows higher levels of despair in young females than in young males. In 2022, 10.5% of women under age 25 reported being in despair compared with 7.5% of young males. The hump shape in unhappiness has vanished in the United States.
The Loss of the U-Shape Curve in Wellbeing
We can also use the Behavioral Risk Factor Surveillance System (BRFSS) for trends in life satisfaction to see if the U-shape has gone too. To measure life satisfaction, we average scores to the item: In general, how satisfied are you with your life? Very dissatisfied=1; Dissatisfied=2; Satisfied=3; Very satisfied=4.
Changes in Life Satisfaction by Age, USA (2005-18 and 2022)
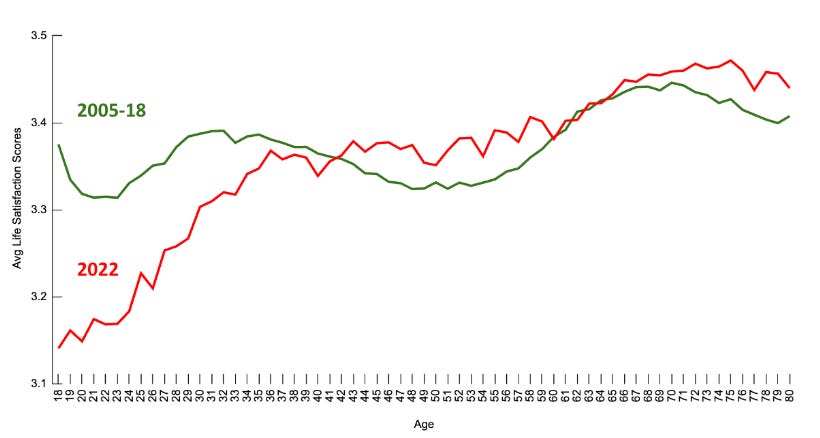
Figure 4. Life satisfaction by age. Comparing average 2005-2018 scores and 2022. Source: Behavioral Risk Factor Surveillance System (BRFSS) surveys. The survey did not include the life satisfaction item between 2019-2021. Note that most data for 2005-2018 comes from 2005-2010. Sample sizes were much smaller between 2011-2018. Sample sizes were large again in 2022 (n = 236,852).
In Figure 4, we plot the data across the age range averaging across collection years 2005-2018 (in green), and we compare it the data that was collected in 2022 (in red). In the former case, life satisfaction declines through age 22 before rising through age 32 and then falling back, giving a U-shape with the usual low point seen in the early 50s. But in 2022, the plot looks entirely different; it rises with age.6
Worsening Trends in Other Measures of Mental Health
We also have data available on anxiety in the United States from 68 waves of the Census Bureau’s Household Pulse Surveys 2020-2022. Respondents were asked (n=5 million): Over the last 2 weeks, how often have you been bothered by feeling nervous, anxious, or on edge? Select only one answer. Not at all=1; Several days=2; More than half the days=3; Nearly every day=4
Figure 5 plots the average response to this question by age. It shows clearly that anxiety declines as we move up through the age scale for men and women, with women having higher levels of anxiety at every age.
Average Anxiety by Age, USA (2020-2022)
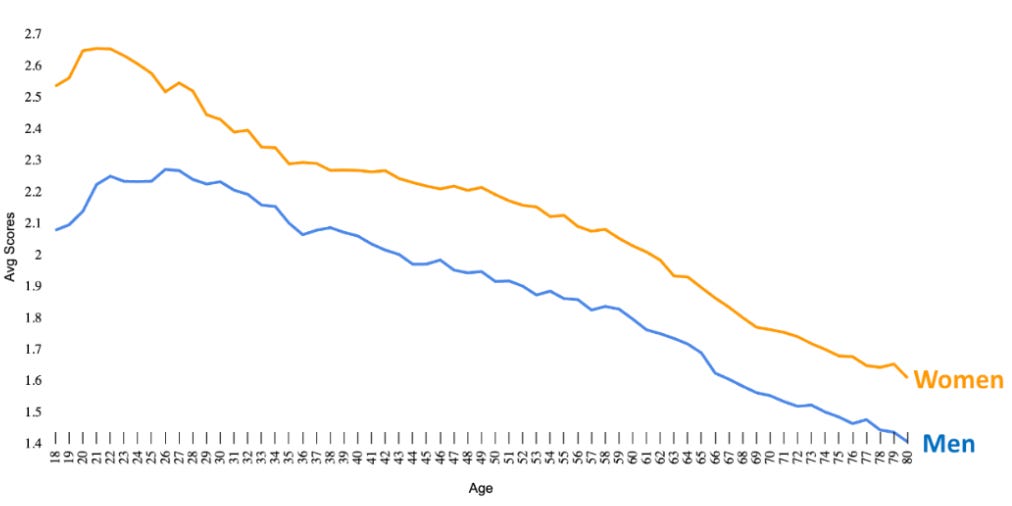
Figure 5. Levels of anxiety across ages. Data from 2020 through 2022 merged together. Source: Census Bureau’s Household Pulse Surveys 2020-2022. Low numbers reflect lower levels of anxiety.
The Trends are International
Figure 6 shows this is not simply an American phenomenon; it also applies to the United Kingdom. In another 2024 paper, we analyzed the UK Household Longitudinal Survey (UKHLS) from 2009 to 2021, which includes a General Health Questionnaire mental health index scored on a scale of 0 to 36 (Likert scale), where a score of 20 or higher we consider to be ‘despair.’ Approximately 8% of all respondents were classed as being in despair in 2009-10, rising to 12% in 2020-2021.
Changes in Despair by Age, UK (2009-19 and 2019-21)
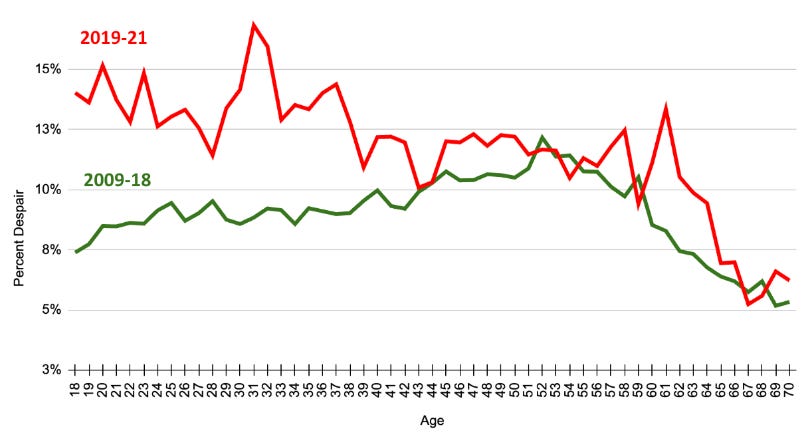
Figure 6. Changes in despair across age, UK. Source: UK Household Longitudinal Survey (UKHLS).
Figure 6 shows that, once again, the hump shape in ill-being by age, which is notable in the earlier period (2009-2018), has disappeared in the later period 2019-2021, to be replaced by a profile of despair that is declining in age. As in the case of the United States, the age profile of despair did not change markedly among those in their late 40s and older, but levels of despair rose strongly among those below their mid-40s, especially among the youngest. (We see similar worsening trends for youth anxiety in the UK, and, as in the US, that data shows that the trends began before COVID. See supplement.)
Figure 7 shows the same pattern from the Come-Here (COVID-19, Mental Health, Resilience, and Self-regulation) survey conducted by the University of Luxembourg in France, Germany, Italy, Spain, and Sweden from 2020-2022. We examine a PHQ depression total score, which is the sum of nine variables relating to depression, with each sub-component coded from 0 to 3. Plus, a life satisfaction score.
Depression and Life Satisfaction by Age, 2020-2022 (France, Germany, Italy, and Spain)
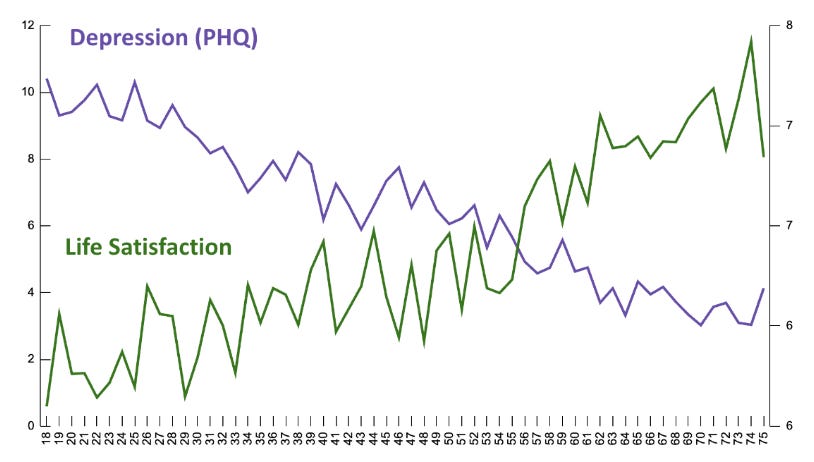
Figure 7. Trends in depression and life satisfaction by age in France, Germany, Italy, Spain, and Sweden, 2020-2022. Source: Come-Here (COVID-19, Mental Health, Resilience, and Self-regulation) survey conducted by the University of Luxembourg. Life satisfaction item: “Overall, in the past week, how satisfied have you been with your life?” using a standard 10-point Likert scale from 0=not at all to 10=completely. The PHQ score declines in age, and life satisfaction rises in age across all five countries combined and separately.
But that isn’t all. There is now overwhelming evidence from around the developed and the developing world that ill-being declines in age essentially everywhere. This global evidence is principally but not exclusively from the Global Minds database. We have now found, astonishingly, that in the years since 2020, ill-being declines in 48 countries – Algeria; Angola; Argentina; Australia; Austria; Brazil; Canada; Chile; Colombia; Croatia, Denmark, Ecuador; Egypt; Finland, France; Germany; Greece, Guatemala; Iceland, India, Iraq; Israel; Italy; Japan; Jordan; Mexico; Morocco; Netherlands; Nigeria; Norway; New Zealand; Pakistan; Paraguay; Peru; Philippines; Saudi Arabia; Slovenia, South Africa; Spain; Sweden; Switzerland; Tunisia; UK; Uruguay; USA; Venezuela and Yemen. In ongoing work (not published yet) with the Global Minds database which is continuously updating its sample, we now have evidence that ill-being declines in age in an additional 34 countries, making 82 in total. The 34 new countries, from both the developing and developed world are as follows – Armenia; Bangladesh; Belarus; Belgium; Bolivia; Cameroon; China; Costa Rica; Côte d’Ivoire; Democratic Republic of Congo; Dominican Republic; El Salvador; Georgia; Ghana; Honduras; Ireland; Kenya; Kyrgyzstan; Malaysia; Mozambique; Nicaragua; Panama; Portugal; Puerto Rico; Russia; Singapore; Sri Lanka; Sudan; Tanzania; Trinidad & Tobago; Ukraine; UAE; Uzbekistan and Zimbabwe.7
Conclusion
The hump shape in ill-being and the u-shape in well-being—the so-called midlife crisis—is a thing of the past, the very recent past. Ill-being now declines with age, and well-being improves with age (for those 18 and older). This change appears to have taken place around 2014-17; it especially impacted young women, and it appears to be global. We have found evidence that mental health improves with age across 82 countries from both the developing and the developed world. That includes countries as different as the US, China, India, Bangladesh, Sweden, Bolivia, Japan, Qatar, Uzbekistan and Tanzania.
The long-studied midlife crisis has now been replaced with a mental health crisis of the young… globally.
He also has documented some problems with regularly used datasets that inaccurately estimate youth suicide rates, including the Global Burden of Disease and the WHO Global Health Estimates.
Note that we address many of these claims in Zach’s post, The Girls Are Not Alright: Responses to Three Claims that the Youth Mental Health Crisis Is Exaggerated; Jean’s post, Is the adolescent mental health crisis real, or just an illusion?; and Zach’s comment to on this recent post.
Note that the graph on the top right is a screenshot from the World Happiness Report, which uses the Gallup World Poll (GWP) data. Danny Blanchflower will show, in a future post, why the GWP is unreliable. Here are just three reasons: The GWP has small unrepresentative samples, especially in big countries (sample sizes are approximately the same in the USA and Malta!), there is poor question design (e.g., did you feel sad yesterday?), and they sample countries in different months of the year (e.g., collecting data in 2008 beforethe financial crisis, making it look like people were happier in 2008 than in 2007 or 2009, when in reality, they were not). But even with these methodological issues, they still found that well-being of young people throughout the Anglosphere has been declining. More soon. Another graph shown in the tweet shows suicide rates averaged across 27 European countries; but those are not split by sex and they do not account for the cultural variations we have been studying and discussing. See Zach’s post on this. And a third graph uses the Global Burden of Disease. See Zach’s post on why that is unreliable.
Despite these concerns, Tobias Dienlin’s review of The Anxious Generation is nuanced and worth reading. Check it out here.
Ferguson is correct that there is not a uniform rise in suicide rates among adolescents across the globe. However, we do see that rates are higher for Gen Z—across the Anglosphere—today compared to any previous generations of girls, and that they are rising in Protestant dominant nations. The key here, however, is that suicide is not a direct readout of the average mental health of a population. Rates respond to a variety of cultural changes, as Durkheim showed long ago. We should expect variation in suicide rates based on a variety of cultural and social factors, as we explain in this post.
Note that one dataset, the Gallup World Poll (the GWP), does not show these trends in many countries (as mentioned in footnote 3). As we will discuss in a future post, the GWP is deeply flawed, with sampling issues, as well as variables that fail to pick up recent trends among the young which makes the findings from the survey questionable.
The finding that the U-shape curve has disappeared is consistent with the recent work of Chen et al (2022) who used the 2022 NORC AmeriSpeak survey, with a sample of 8618 individuals. Participants responded to various measures of well-being, including happiness, health, meaning, character, relationships, and financial stability. Items were self-reported on a scale of 0 to 10. The authors found that “well-being increased monotonically cross-sectionally with age for overall well-being, the domains, and across all individual items.”
We have data on many more countries in the Global Minds dataset that also appear to have declining ill-being by age, but sample sizes in many are relatively small, so we just report here estimates from countries with more than 1000 observations. We have evidence from a further 8 countries of declining ill-being in age, making 90 in all, which have between 500 and 1000 observations – Afghanistan (n=642), Azerbaijan (n=886); Hong Kong (n=519); Kazakhstan (n=667); Moldova (n=705); Syria, (n=797); Taiwan (n=740) and Turkey (n=510).

Leave a Reply
You must be logged in to post a comment.